


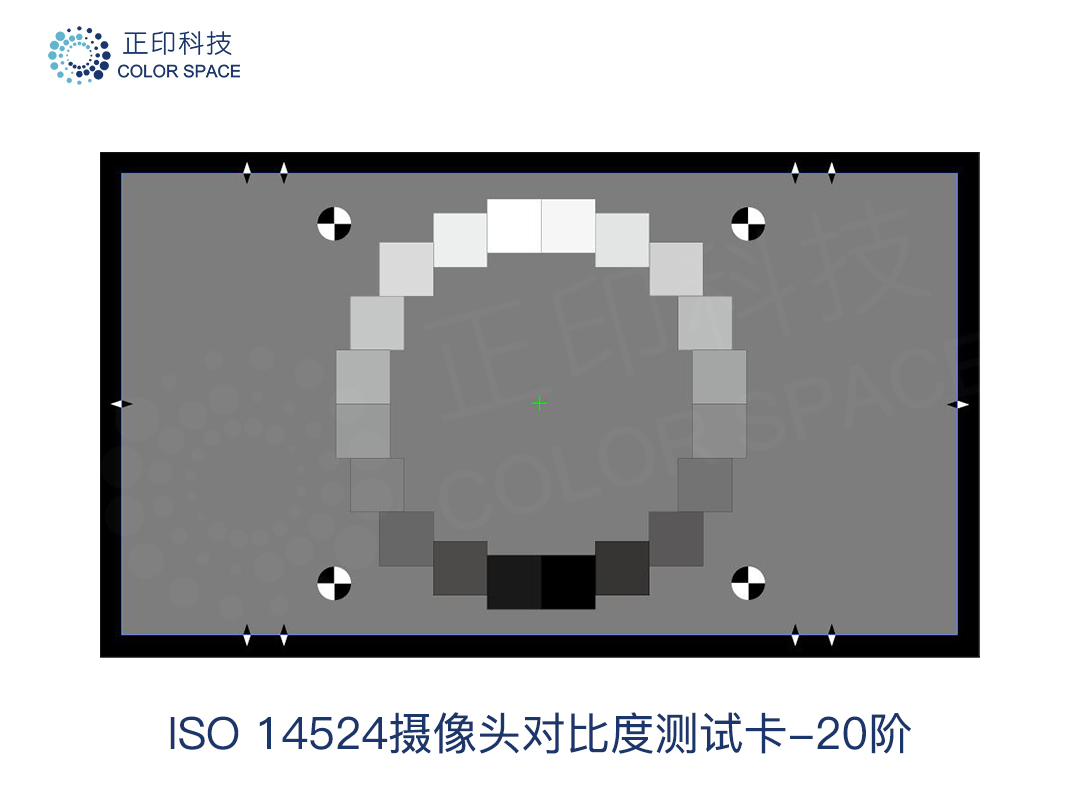
A reflective grey-scale chart built to ISO 14524:2009 — Photography — Electronic still-picture cameras — Methods for measuring opto-electronic conversion functions (OECFs). Twenty neutral patches are arranged in a ring around central alignment marks, so the chart can be sampled across the field rather than along a single strip.
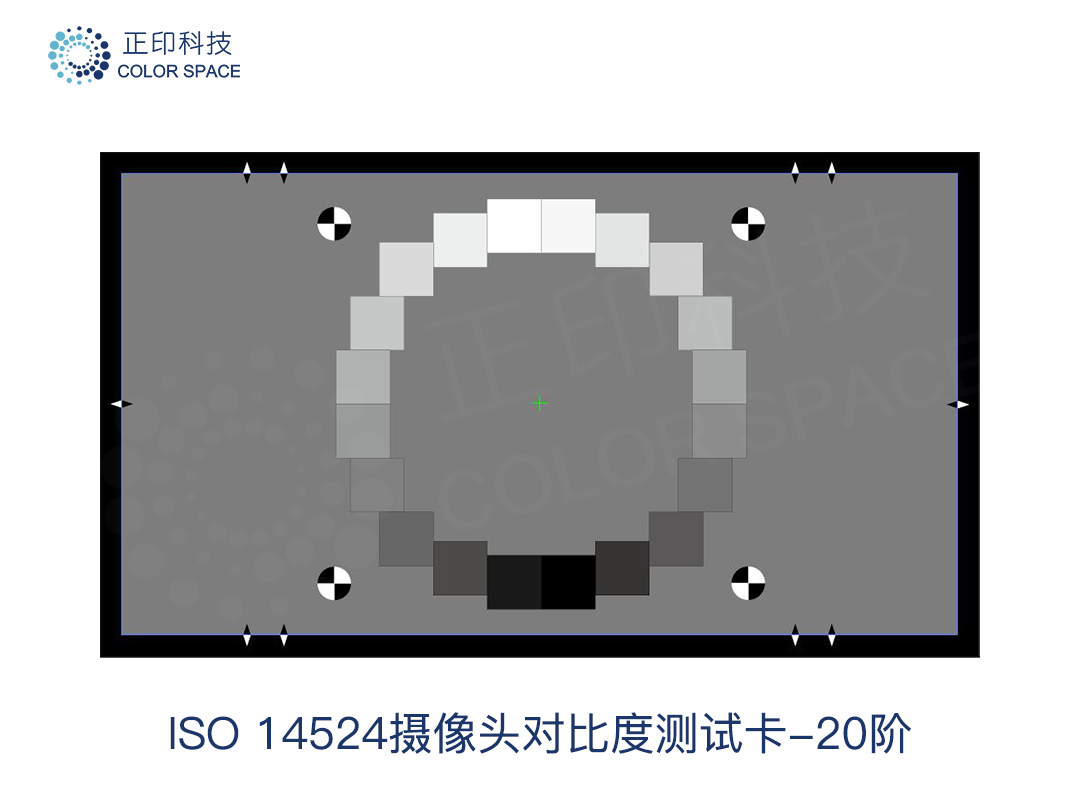
The opto-electronic conversion function describes how scene luminance maps to digital output. Photograph the 20 patches of known density, read the resulting code values, and you can plot that curve and see where a camera's response is linear, where it rolls off, and how much highlight and shadow detail survives. Typical uses:
The same patches also support noise and SNR measurements, but noise methods and limits should follow ISO 15739 rather than ISO 14524. Record and assess the two results separately.
Both charts cover densities from 0.10 to 2.00; the difference is sampling density and where each fits in a workflow.
12 阶 CS-TC003-12 | 20 阶 CS-TC003-20 | |
灰阶密度范围 | 0.10–2.00 | 0.10–2.00 |
采样点数 | 12 点 | 20 点 |
适用场景 | 快速判定、产线抽检 | OECF 曲线拟合、研发调校、失效分析 |
Because the density range is identical, results are directly comparable and the two charts can be used in the same test routine. The 20-step version gives a smoother OECF curve and makes shoulder and toe behaviour easier to read; the 12-step chart is quicker to analyse and suits line-side checks where cycle time matters.
参数 | ISO 14524摄像头对比度测试卡 |
型号 | CS-TC003-20 |
测试卡尺寸 | 514mm × 295mm |
有效尺寸 | 494mm × 278mm |
灰阶数 | 20 阶(单个灰阶块 31.6mm × 31.6mm) |
灰阶密度 | 0.1、0.15、0.21、0.27、0.33、0.39、0.46、0.53、0.61、0.69、0.77、0.87、0.96、1.07、1.19、1.31、1.45、1.61、1.79、2.00 |
背景密度 | 0.74 |
对比度 | 80 : 1 |
类型 | 反射式 |
Q:Is OECF the same as gamma?
A:No. OECF is the measured luminance-to-output curve; gamma is a single number fitted to it. OECF shows curvature and roll-off that a gamma value hides.
Q:Can I measure noise with this chart?
A:Yes. Compute SNR from the same patches, but apply ISO 15739 methods and limits for noise, not ISO 14524.
Q:Do I need a lab light source?
A:A stable, uniform source is strongly recommended. Reflective charts are sensitive to illumination uniformity.
Q:Can a 12-step chart replace the 20-step one?
A:For trend checks, yes. For curve fitting and shoulder or toe analysis, the 20-step chart is the better tool.
Q:Do you offer custom versions?
A:Yes — size, mounting and patch densities can be customised; the final specification is confirmed after review.
[Book a lab session] For product and test-service enquiries: sales@colorspace.com.cn

Follow ColorSpace on WeChat for industry news, events and solutions.
Contact: sales@colorspace.com.cn
Phone: 15817270587
Tel: configweb_tel
Email: sales@colorspace.com.cn
Add: South Building #2-1101, Lv Di Qi Hang Office Building, Hou Sha Yu, Shun Yi District, Beijing, China