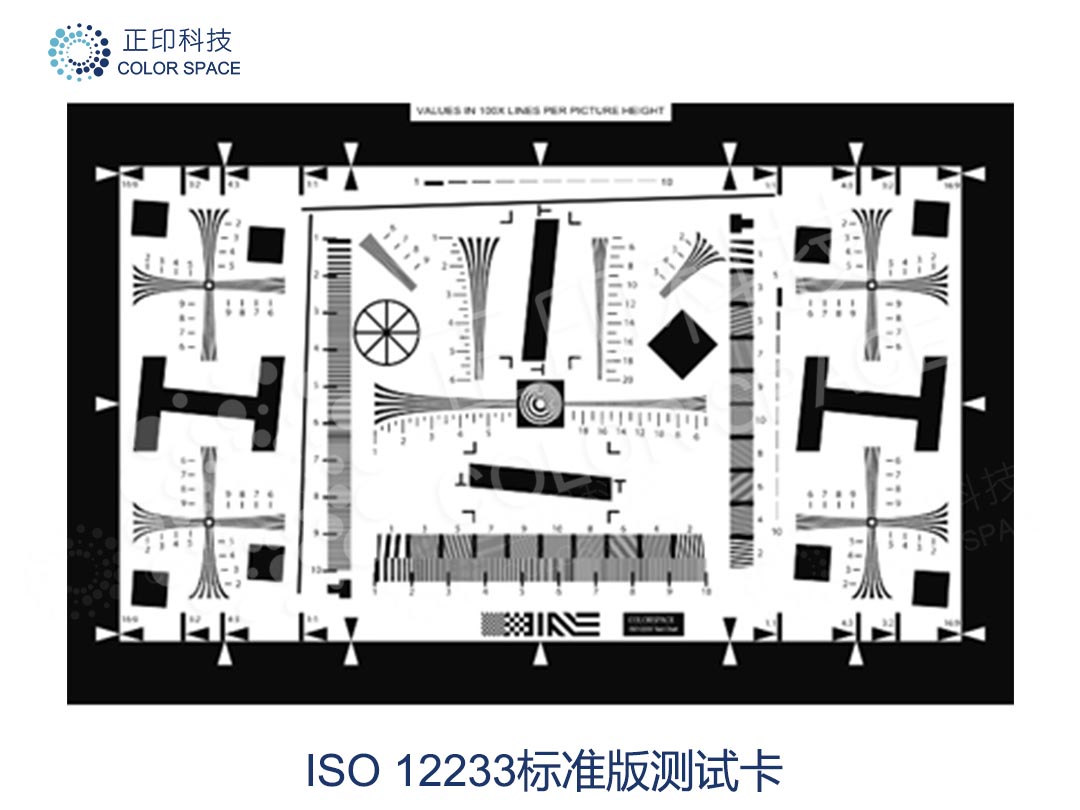
The ISO Camera Resolution Chart conforms to the ISO-12233:2000 standard, “Photography-Electronic still picture cameras – Resolution measurements”. Hyperbolic wedges for resolution evaluation range from 100 – 2000 lines per picture height. Other features include checker patterns, multiple slant-edge lines, a center-focus zone plate and framing marks for 1:1, 4:3, 3:2, and 16:9 aspect ratios.
Notes: This chart is used to measure sharpness from slanted-edge patterns (as Spatial Frequency Response = SFR) using the Imatest SFR module. It can also measure resolution from the hyperbolic wedges using the Imatest Wedge module (a part of Rescharts).
There are two types of processes: photographic or inkjet printing.

Product Parameters:
Reflective (matt/semi-matte/dark matte)
Matte paper/ink can be used to reduce reflected light, but is slightly less sharp than semi-gloss paper. Semi-gloss paper/ink is recommended for most applications.
Parameters
ISO 12233 Digital Still Camera Resolution Chart
Model
CS-TC013
Size
ISO Size
Model
Active Image Size
Charts Size
0.1X
CS-TC013-0.1X
20mm × 35.6mm
30mm × 45mm
0.5X
CS-TC013-0.5X
100mm × 178mm
125mm × 200mm
1X
CS-TC013-1X
200mmX356mm
250mm × 400mm
2X
CS-TC013-2X
400mmX711.1 mm
500mm × 800mm
4X
CS-TC013-4X
800mmX1422.2mm
1000mmX1600mm
8X
CS-TC013-8X
1600mmX2844.4mm
2000mmX3200mm
Type
Spectrum
VIS
Relevant standards
ISO12233:2000 Photography-Electronic still-picture cameras - resolutionmeasurements
Scope of Application:
The ISO12233 standard applies to the analysis of the sharpness of image and video capture devices such as civilian still photo digital cameras hereinafter referred to as (DSC), mobile phones, and surveillance cameras. When the resolution of still photographs is recorded in catalogues, etc., some products use the measurement method specified in this standard.
References to standards and documents:
The following standards are referenced in this standard and are part of the provisions of the purchase cost standard. These referenced standards are applicable to their new versions (including additions):
① ISO12233:2000 Photography-Electronic still-picture cameras - resolutionmeasurements
② ISO7589:2002 Photography–Illuminants forsensitometry-Speccificationsfordaylight,incandescent tungsten and printer
Terms and Definitions:
a) 分辨率resolution:The limit at which a fine pattern can be distinguished, except for jaggies. Expressed as the number of bars per unit height of the screen.
b) 锯齿aliasing:When the sampling frequency is less than two times the highest frequency of the image signal, noise with wave overlap is generated near the higher harmonics of the sampling frequency.
Chart:
4.1 ISO12233 resolution test chart4.2 Meaning of the numbers recorded in the ISO test chartThis standard is based on 12233, and the test chart directly uses the ISO12233 test chart, which contains various styles, and this standard (visual resolution) mainly uses the horizontal J1, K1; vertical J2, K2; and 45° tilt direction of the JD, KD and other styles.
When using an ISO test chart, it is not necessary to use that test chart directly. You can also cut out the necessary parts and use them after re-splicing and arranging.
4.3 Test charts other than ISO test chartsThe effective height of the test chart is photographed so that it fills the entire screen, and the number of strips per unit of height in the screen is given by the number * 100 of the pattern. It is not necessary for the effective height of the test card to fill the entire frame when shooting, but it is necessary to calibrate it.
It is also possible to make and use your own test cards that are identical to the ISO test charts, in which case the following matters specified in ISO 12233 need to be met.
① The ratio of the reflectivity Rmax of the white background part to the reflectivity Rmin of the large black part is 80>Rmax>Rmin>40.
② The positional accuracy of each pattern is 0.2mm (+-0.1% of the screen height) relative to the specified position.
③ Line width is +-5%.
④ The reflectance ratio Rmax/Rmin of the finest part (white and black parts) of the hyperbolic patterns K1 and K2 is 18 or more. However, this is only the "recommended" level (AnnexB of ISO12233).
Transmission charts may also be used. In this case, the reflectance of the above items should be interpreted as transmittance. When transmittance charts are used, they are illuminated with diffuse light. Regardless of whether it is reflective or transmissive, the pattern used for evaluation must have neutral spectral characteristics.
Use the help:
The ISO12233 resolution chart contains 3 types of resolution tests as shown below:
1. SFR test
2. MTF Test (Frequency Line test)
3. TVLine test (wedge line test)
The SFR test must be tested with software, so I will not explain too much here; the frequency line test can be observed with the naked eye.
Advantages of wedge diagram testing:
Disadvantages of the wedge diagram test:1. very intuitive, observable with the naked eye;
2. lower testing requirements relative to SFR;
3. Large data coverage, more accurate than frequency line test;
Software can be used to assist the test to get more accurate data.
1. Observation with the naked eye will vary from person to person, and the results are not stable and objective enough;
2. when moiré is produced, it is impossible to judge the results with the naked eye;
3. the results can vary greatly with slight changes in the angle at which the image is taken;
For more information, please contact: sales@colorspace.com.cn

Follow [ColorSpace] for industry news/events/solutions
Contact: sales@colorspace.com.cn
Phone: 15817270587
Tel: 400-886-3881(周一至周五 9:00~18:00)
Email: sales@colorspace.com.cn
Add: South Building #2-1101, Lv Di Qi Hang Office Building, Hou Sha Yu, Shun Yi District, Beijing, China